Did you know that a person’s average time for productivity at work within an 8-hour timeline per day is only 3 hours? Yes, it’s that limited. Apart from the constrained time, there are other factors too that could consume your time. Just think about lunch breaks, meetings, and those small chats with your coworkers – all of these eat up your time.
Those 3 hours of productivity, if you aren’t careful, can quickly go down the drain. An average employee who only remembers 30% of what she sees and 10% of what she hears can utilize a visual approach to boost workplace productivity and increase effective Sales Communication. Because we are visually wired by nature, we can comprehend a visual scene in just a fraction of 1/10 seconds.
It Pays to Be Visual
We are visual learners. We can process visuals as fast as 60,000x than text. The core reason why the tools that make employees engage through visuals effectively leverage the probability of generating positive results with just about anything, be it understanding a lesson or increasing workplace productivity.
Visuals not only affect long-term memory, but they can also enhance your learning and comprehension skills by 400%. Visual approaches are also effective in overcoming language barriers which are a significant communication obstacle in many workplaces.
There are many tools and methods to enhance your focus and organize your work, but not all of them generate positive results. To help increase your productivity and streamline your job, you can use the following visual tools below.
Engage With Your Employee Through Flowcharts
A flowchart is one of the most common productivity tools you can find in your office. It is an instrument for visualizing the steps of a particular process. A flowchart demonstrates the relationship between each process step and reveals parts in the process that may be erroneous or confusing.
Using a flowchart in project planning or strategy development could help in different ways:
- It functions as a map of the entire process (record and monitor the progress made).
- Looks for ideal methods to complete every step of the process.
- Identify project areas that need improvements.
Apart from mapping processes, you can also use flowcharts in problem-solving and making decisions. For instance, if you’re in a dilemma between choosing the best between two or more alternatives, you can use it to make a well-contemplated decision. Similarly, you can use a flowchart to curate development lessons and optimal solutions when a specific problem arises.
A mind map is a tool that allows you to visualize strategies, concepts, or ideas, regardless of their level of difficulty. It engages both your left brain (relates to mental skills, including numbers, sequences, letters, and lines) and the right brain (relates to mental skills, including an image, spatial awareness, color, and rhythm).
Thus, creating a mind map requires the engagement of both sides of the brain as it combines colors, images, spatial arrangement, and lines. It stimulates your creativity and reinforces your thinking power. If you’re developing a strategy, brainstorming an idea, or even planning an event or a task, you can use a mind map to give more structure to the entire process.
Improve Project Planning with Gantt Charts

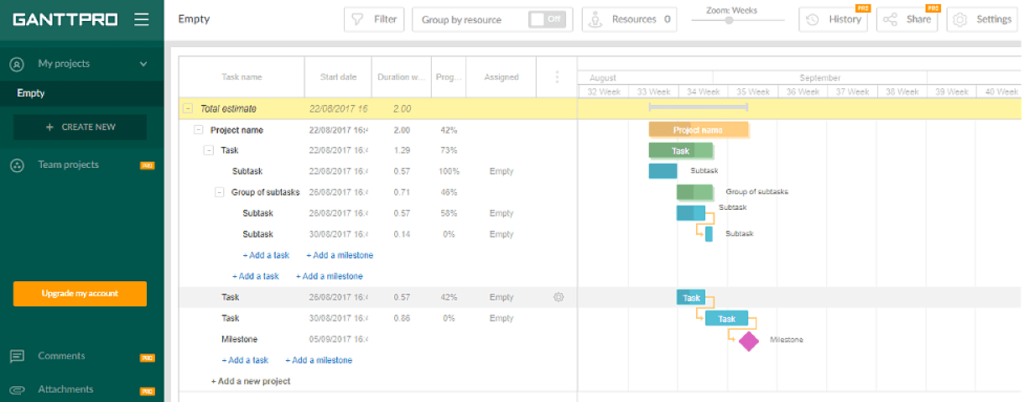
A Gantt chart is another project planning tool you can use to visualize a project’s schedule and track and record your progress for the entire duration. It is also helpful for setting up deadlines and when allocating resources.
A detailed Gantt chart will provide you with a quick overview of the project’s essential details, such as the task names, who are in charge of them, and due dates. When tracking their progress, it could be a handy productivity tool for sales communication or estimating your duties.
Increase Workplace Productivity with Organizational Charts

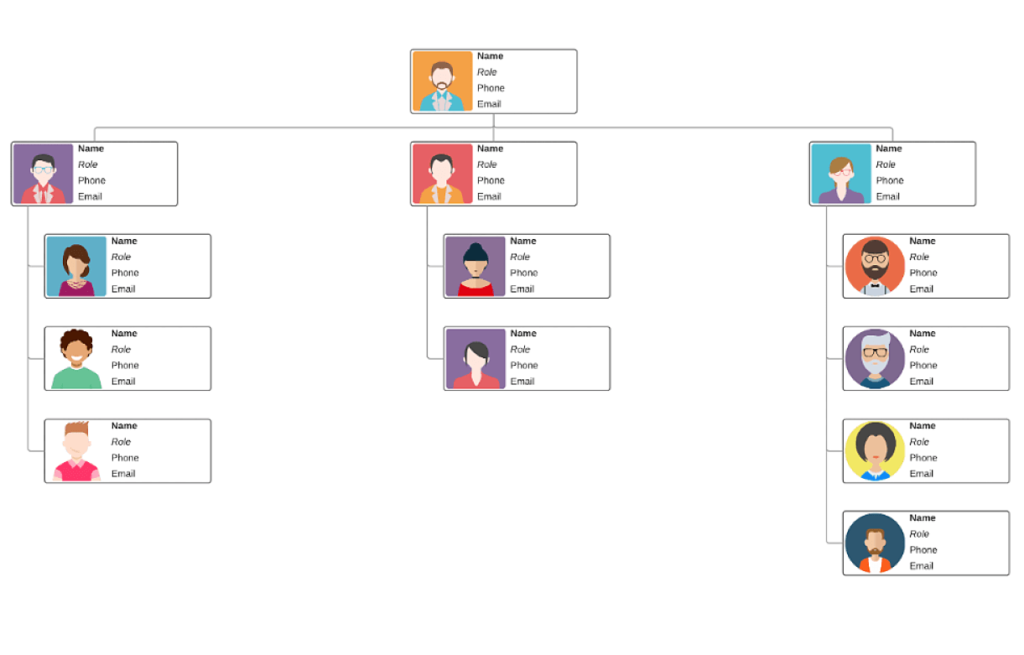
Organizational charts are traditionally used to illustrate an organization’s structure graphically. While it demonstrates responsibilities and job titles, it can also streamline a reporting structure between or within departments. You can also use it to look for ideal employees when allocating resources and help new employees understand departments and company hierarchies better.
Organizational charts are also valuable for setting up deadlines. With a clear picture of the reporting structure, an org chart even helps new employees get to know their job responsibilities and their co-workers during their first few days.
It is also helpful for HR professionals who want to measure KPI (Key Performance Index) to find out who deserves promotion and recruitment.
Solve Issues More Effectively with Fishbone Diagrams

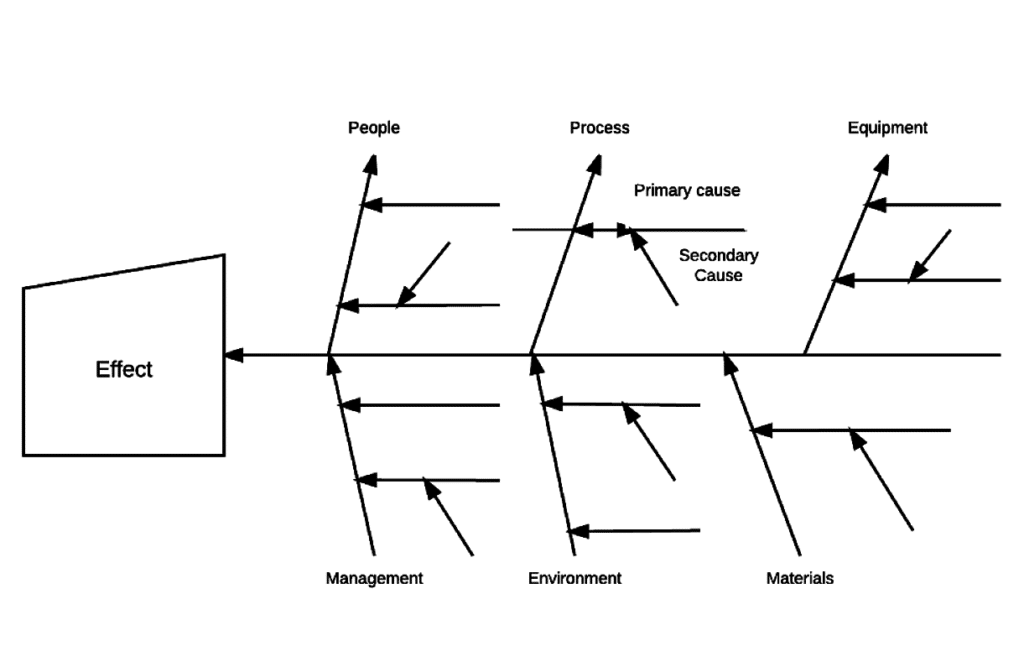
Fishbone diagram, most commonly known as the cause-and-effect diagram, is a robust approach to determine the cause of a particular issue. Simply put, it’s a visual problem-solving technique.
As the name suggests, fishbone diagrams have a structure similar to the bone of a fish. The head represents the issue that needs a solution, while the bones depict potential causes. It is even considered a time-saving tool when structuring a thorough analysis of a problem or brainstorm session.
Takeaway
A visual method or tool possesses the ability to engage both sides of the human brain, which means that you get to exercise your mental agility while fixing productivity issues. And it’s something that employees will benefit from. So, the next time your team or department is lagging, use one of the above tools and get ahead with the issues.
Author Credits for Jeremy Miner
Before founding 7th Level Communications, Jeremy co-founded and served as Chief Sales Officer of an online education start-up that he took from zero to $37M in revenue the first year. Previously, he was Vice President of Sales at Wealth Masters International, a provider of personal finance training and educational products. With responsibility for recruiting and training the worldwide sales organization, he increased annual revenue from $12 Million to $75 Millions in three years. Prior to Wealth Masters, Jeremy was Vice President of Sales and the top individual salesperson at Life Path Unlimited. His sales expertise helped propel this personal development training and education company from start-up to a market leader with $55 Million in annual revenue in only two years. Formerly, he was the top salesperson at Liberty League International in the same industry niche, where he was instrumental in the company setting new industry records for sales revenue.


